Co-Founder & CEO

Blue carbon is one of the fastest-growing segments of the voluntary carbon market, and for good reason. Mangrove ecosystems store up to 10 times more carbon per hectare than terrestrial forests (Twilley et al., 2018, Carbon sequestration in mangrove forests), protect over 200 million people from coastal flooding (Shivlani et al., 2021, Mangroves shelter coastal economic activity from cyclones — note: the 200M figure refers to cyclone-exposed coastal populations, not flood-protected; for flood protection specifically, see Menéndez et al., 2020, Scientific Reports, which puts the figure at 15 million), and support biodiversity that underpins entire coastal economies (Worthington et al., 2025, Communications Earth & Environment). Yet blue carbon still represents less than 1% of all voluntary carbon credit issuances, with only a handful of projects actively issuing credits worldwide. The bottleneck isn't demand. It's the complexity of developing, assessing, and monitoring these projects at scale. At Kanop, we've been building the satellite-powered data infrastructure to help solve that problem. Here's how we've applied it across three blue carbon projects spanning West Africa, South Asia, and Southeast Asia.
The blue carbon market is experiencing a significant supply-demand imbalance. Buyer interest in high-integrity nature-based credits continues to grow, driven by corporate net-zero commitments, evolving regulatory frameworks, and increasing recognition that coastal ecosystems deliver exceptional co-benefits beyond carbon sequestration.
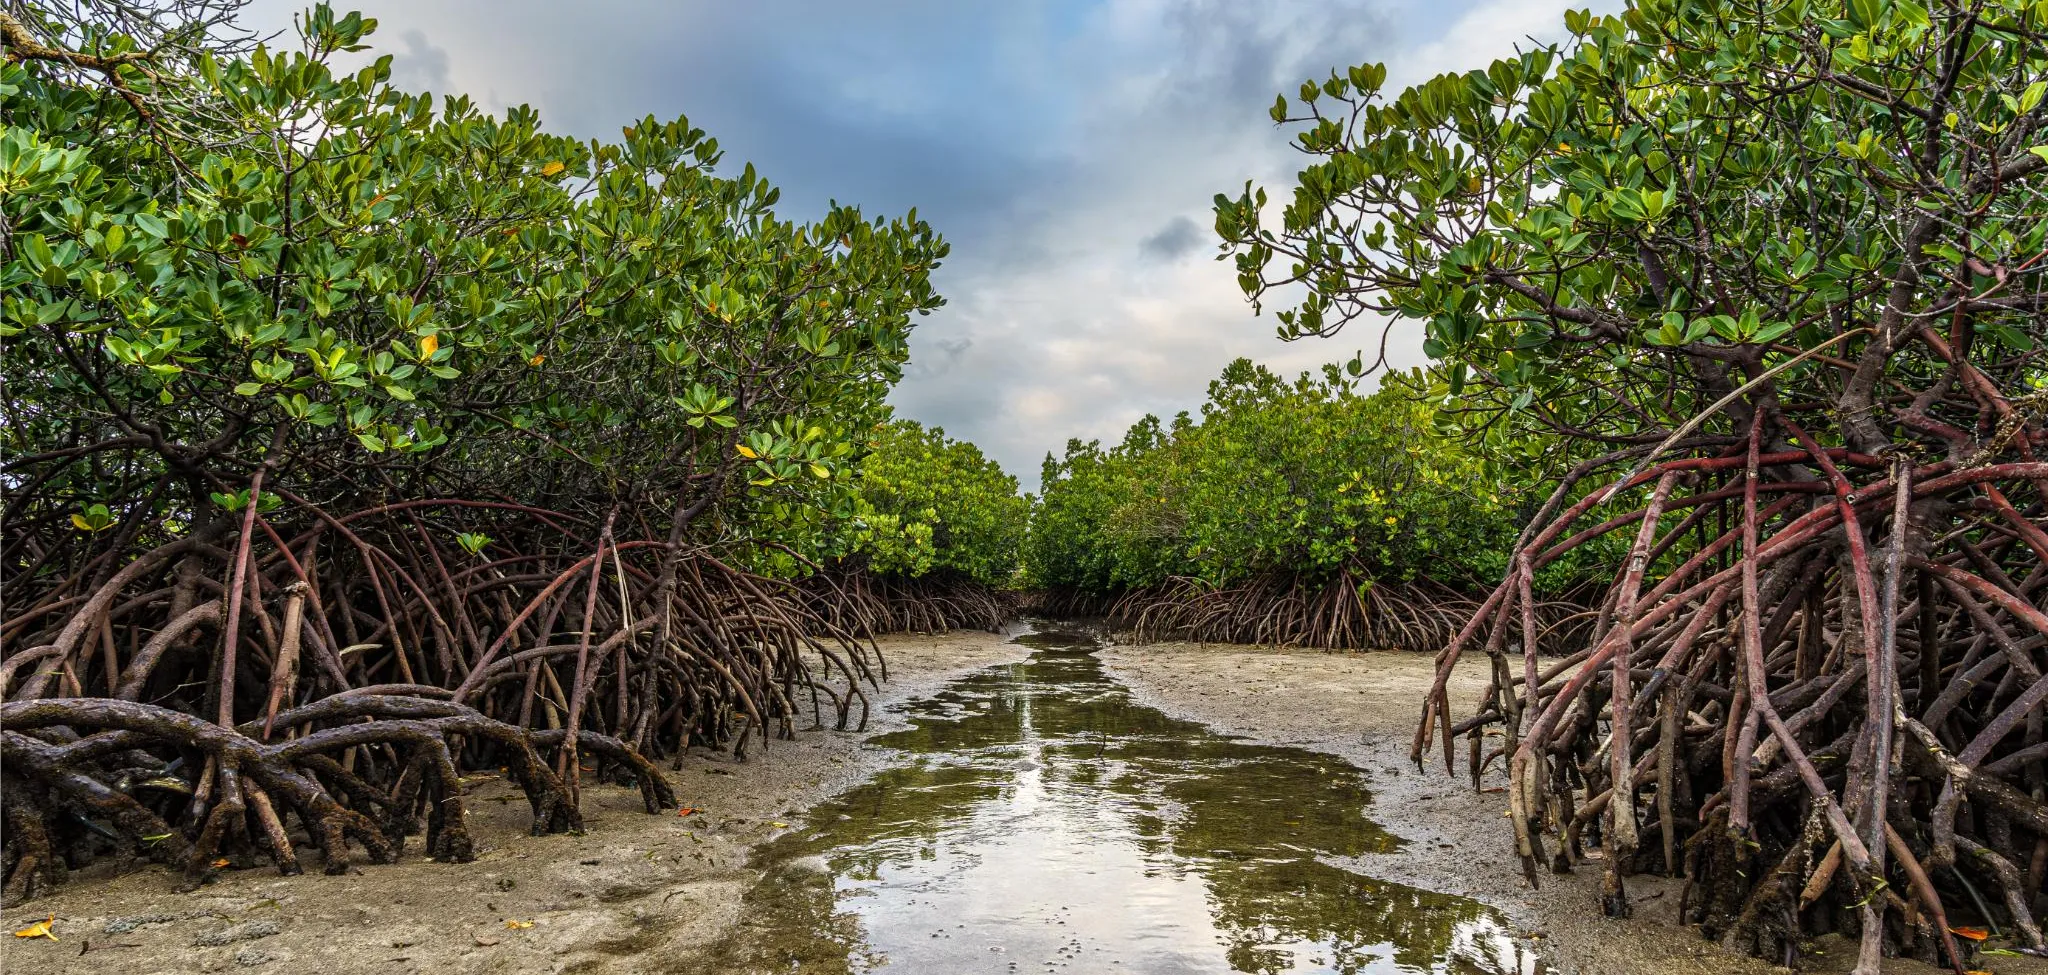
Mangroves sit at the center of this momentum. They store an average of 1,023 tonnes of carbon per hectare, with up to 90% of that carbon locked in sediments rather than biomass, making it significantly more durable than forest carbon (Donato et al., 2011, Mangroves among the most carbon-rich forests in the tropics; soil fraction: Sanderman et al., 2018, A global map of mangrove forest soil carbon at 30 m spatial resolution). Beyond carbon, mangroves serve as natural coastal defenses, nursery habitats for fisheries, and livelihood anchors for millions of coastal communities.
On the methodology side, both Verra and Gold Standard have recently updated or released frameworks that explicitly integrate remote sensing as a primary quantification tool. Verra's VM0033 (Methodology for Tidal Wetland and Seagrass Restoration) is becoming the comprehensive blue carbon methodology, while Gold Standard released its first-ever dedicated mangrove methodology in August 2024, developed with Forliance, which positions remote sensing alongside field measurement as a core approach.
This convergence of market demand, science, and methodology is creating real opportunity for project developers, investors, and conservation organizations. But realizing that opportunity requires reliable, scalable data at every stage of the project lifecycle.
Blue carbon projects present unique measurement challenges that differ from terrestrial forest projects in important ways.
First, accessibility. Mangrove ecosystems are, by nature, difficult to survey on foot or by boat. Tidal zones, dense root systems, and remote coastal locations make traditional field sampling expensive and logistically complex. This is precisely why both Gold Standard and Verra have built remote sensing into their latest mangrove methodologies.
Second, the carbon accounting is more complex. Unlike terrestrial forests where aboveground biomass is the primary carbon pool, mangroves store the vast majority of their carbon belowground in soils. Accurately quantifying total carbon stocks requires combining aboveground biomass estimates with soil organic carbon models, and tracking changes in both over time.
Third, blue carbon projects face permanence risks that are distinct from deforestation-driven threats. Sea level rise, coastal erosion, and changes in sediment dynamics can fundamentally alter whether a restoration site remains viable over a 20- or 30-year crediting period. Verra's VM0033 explicitly requires sea level rise risk assessment and allows project boundaries to adjust for landward mangrove migration, reflecting the reality that these ecosystems are dynamic.
Finally, historical land use analysis is essential. Methodologies require demonstrating that project areas historically supported mangrove ecosystems (for restoration projects) or that existing mangroves face credible deforestation threats (for conservation projects). Satellite archives going back decades are often the only practical way to establish this baseline.
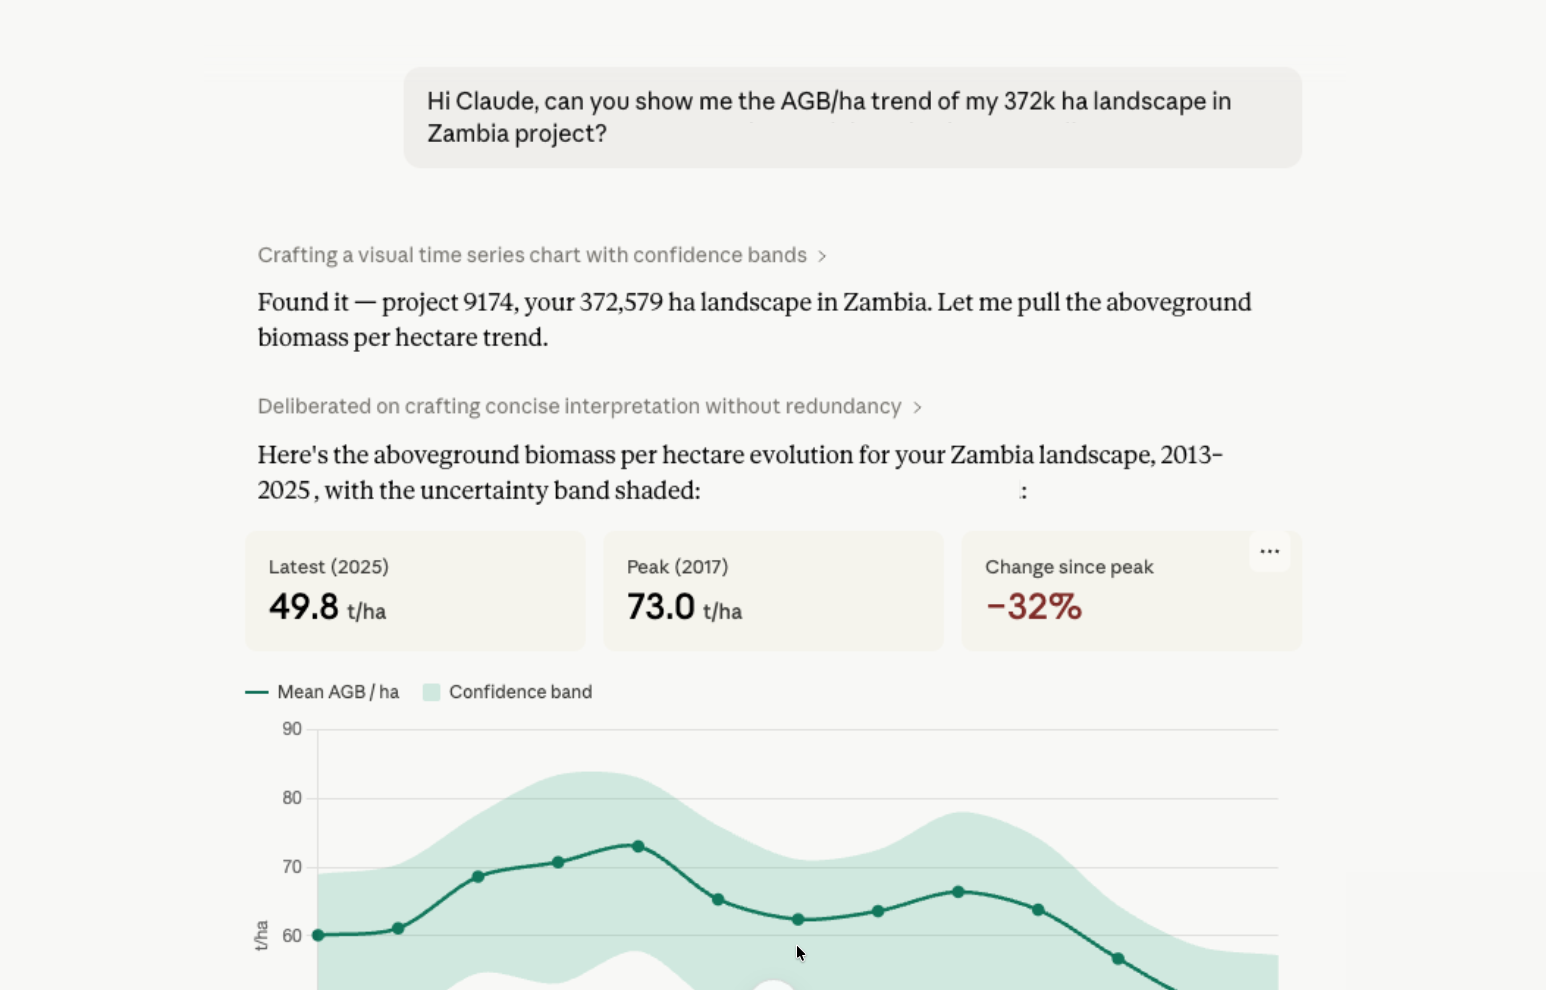
At Kanop, we support blue carbon projects with AI-powered satellite analytics across three critical phases: project assessment, feasibility and design, and ongoing monitoring. Our platform combines optical imagery (Sentinel-2) with Synthetic Aperture Radar (SAR) data from Sentinel-1, which is particularly important for mangrove environments where persistent cloud cover limits optical observation. We deliver aboveground biomass estimates, land use and land cover classification, canopy height and cover data, and custom analyses, all at 10-meter resolution with uncertainty quantification.
Over the past two years, we've applied these capabilities to three blue carbon engagements, each addressing a different stage of the project lifecycle and a different client need.
Client: ALLCOT (now part of Karbon-X Corp) Location: Sine-Saloum Delta and Casamance regions, Senegal Project type: Mangrove restoration (VM0033) Scope: ~7,500 hectares
The ABC Mangrove Restoration Project in Senegal is one of the most significant blue carbon projects currently in development. Led by ALLCOT in partnership with Woodside Energy, the project covers approximately 7,500 hectares of mangrove restoration across Senegal's Sine-Saloum Delta and Casamance regions, with planting running from 2022 to 2025. The project follows Verra's VM0033 methodology and became a landmark initiative as the first project submitted through Verra's digitalized Project Hub in collaboration with the Hedera Foundation.
Kanop was engaged to deliver a comprehensive sea level rise impact assessment, a critical requirement under VM0033 and Verra's AFOLU Non-Permanence Risk Tool (v4.2). The methodology requires project developers to determine how much land will be lost to sea level rise during the crediting period due to wetland migration, inundation, and erosion.
To answer this question, we built a dynamic connected bathtub model that goes well beyond simple inundation mapping. The model integrates regional sea-level rise projections from the IPCC's Sixth Assessment Report (AR6) under the SSP5-8.5 high-emissions scenario, localized for Dakar, Senegal. We combined these projections with high-resolution elevation data from the Copernicus Global DEM (GLO-30) at 30-meter resolution and current mangrove distribution from Global Mangrove Watch v4.0.
What makes this model dynamic rather than static is the incorporation of key coastal processes specific to the Senegalese context. We modeled sediment accretion at a conservative 2 mm/year, informed by regional studies showing that the Sine-Saloum and Casamance are inverse, sediment-limited estuaries where accretion rates sit below West African averages. We also incorporated subsidence rates (0.1 mm/year based on Sentinel-1 InSAR ground displacement data), tidal range variability (1.7 meters), wave climate analysis, and species specific tolerance to submersion. Critically, the model simulates not just habitat loss but also potential landward mangrove migration, gated by suitability criteria derived from existing mangrove reference pixels.
The output is a 100-year projection (2025-2125) in 5-year increments, showing year-of-submersion maps and year-of-establishment maps for both the project area and a progressive buffer zone. This gives ALLCOT and their verification body a transparent, literature-supported assessment of long-term project viability, exactly the kind of evidence that Verra's non-permanence risk framework requires.
Client: Schneider Electric Advisory Services Location: Sundarbans, West Bengal, India Project type: Mangrove restoration feasibility and eligibility analysis Scope: ~300,000 hectares
Schneider Electric Advisory Services, a global leader in climate consultancy, is developing the Sundari Mangrove Restoration Project, an ambitious initiative aimed at protecting and restoring at least 4,000 hectares of degraded mangroves in the Sundarbans, West Bengal. The project targets carbon credit certification under the VCS Standard (VM0033).
Kanop was engaged to determine the restoration potential within the grouped project area while ensuring compliance with Verra eligibility criteria. The total project zone encompasses nearly 300,000 hectares, but not all of it historically supported mangroves. At Kanop, we identified approximately hectares that historically supported mangrove ecosystems and focused our analysis on that area.
The study was structured around four analytical components, each targeting distinct temporal patterns of mangrove loss and degradation. We identified areas deforested before 2015 (using GMW baselines from 1996 and 2015 cross-referenced with Landsat 8 imagery), areas deforested since 2015, areas experiencing active degradation and canopy thinning, and areas with stable but degraded mangrove cover. For each component, we applied exclusion layers to remove existing VCM project areas (to avoid double-counting), protected areas from the World Database of Protected Areas, and land converted to built-up zones, aquaculture farms, or salt pans.
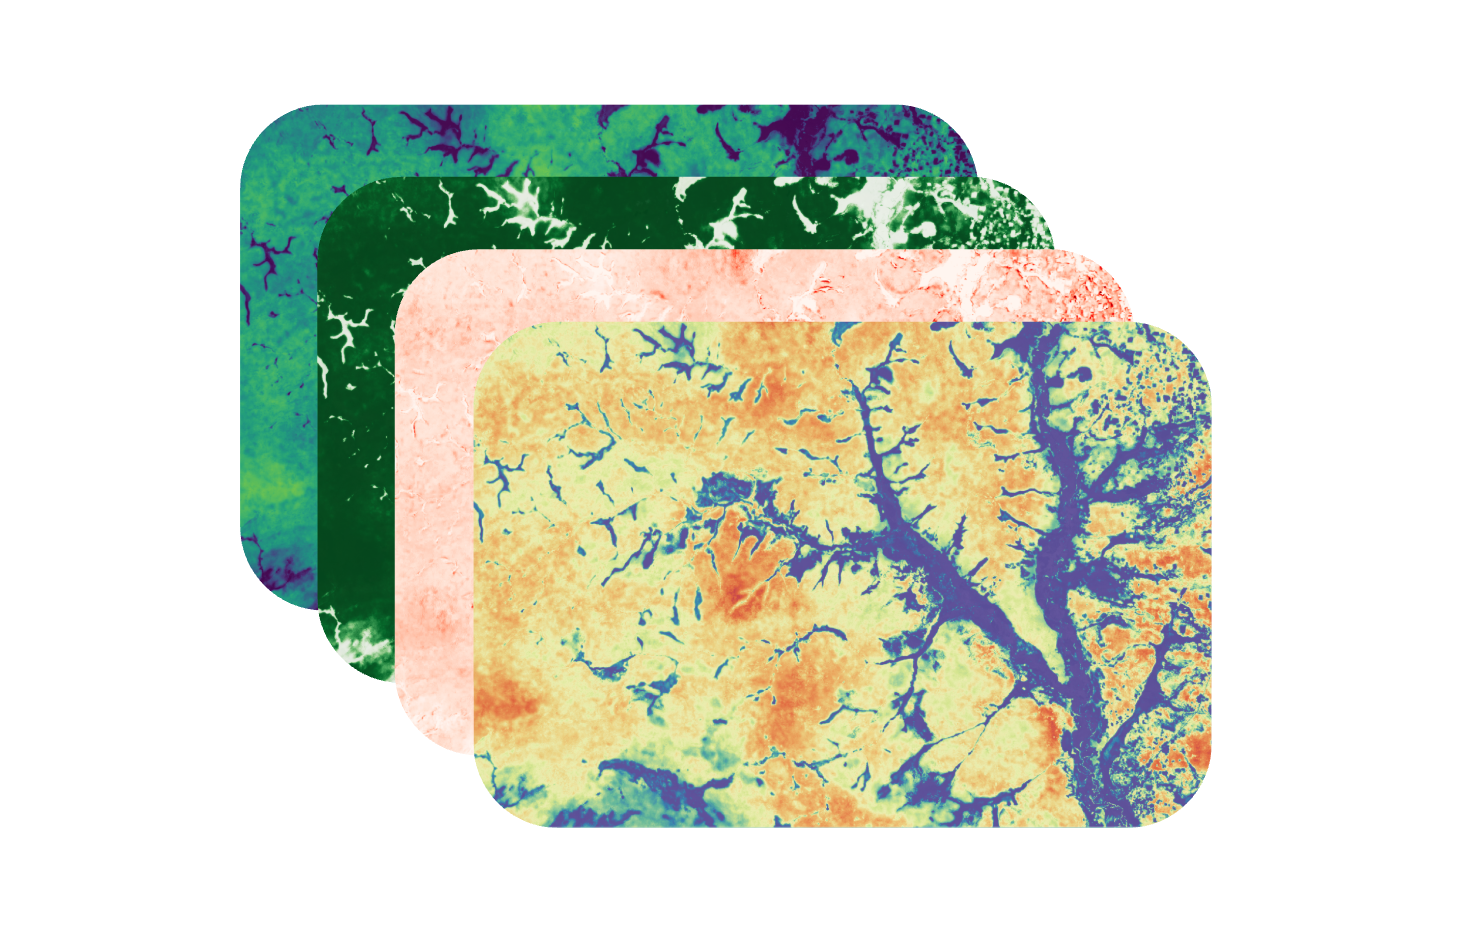
The technical approach combined a custom weighted spectral index blending NDVI, NDMI, GNDWI, and SAVI (weighted 30%-30%-20%-20%), calibrated against Global Mangrove Watch reference data and validated through histogram analysis of spectral distributions across healthy, degraded, and non-mangrove areas. This allowed us to classify mangrove condition across the entire study area using Landsat 7 (back to 1999) and Landsat 8 imagery (2015 and 2024).
The results revealed the complex dynamics of this ecosystem. While healthy mangrove cover in the study area grew by about 25% between 1996 and 2015, localized losses persisted. From 2015 to 2024, healthy mangrove was lost and additional areas shifted from healthy to degraded condition, driven significantly by the impacts of Cyclone Amphan in 2020, which damaged some of the mangrove forests. We also identified areas of active degradation where canopy thinning is ongoing.
The deliverables included detailed deforestation and degradation maps for each temporal component, a comprehensive land cover transition matrix tracking 27 distinct change categories across three time periods (1996, 2015, 2024), and a 20-page technical report with methodology documentation and academic references. This gave the Schneider Electric team the spatial intelligence needed to select optimal restoration sites where intervention will be most effective and additional, while avoiding areas where natural regeneration is already occurring or restoration is no longer feasible.
Client: WWF Switzerland Location: Vietnam, Cà Mau province Project type: Mangrove monitoring Scope: Ongoing monitoring engagement
WWF Switzerland engaged Kanop to support mangrove monitoring efforts in Vietnam, where coastal ecosystems face pressure from aquaculture expansion, coastal development, and climate impacts. Vietnam hosts some of Southeast Asia's most ecologically important mangrove areas, including the Mekong Delta and the Ca Mau Peninsula, and accurate monitoring data is essential for conservation planning and impact reporting.
Kanop provided satellite-based monitoring outputs including mangrove extent mapping, land use and land cover change detection, and biomass tracking over time. By combining SAR and optical satellite data, our platform delivered consistent monitoring even during Vietnam's monsoon season when cloud cover limits optical observations, a common challenge in tropical mangrove environments.
For conservation organizations like WWF, reliable monitoring data serves multiple purposes. It enables evidence-based reporting to donors and partners, supports adaptive management decisions (identifying areas of mangrove loss or recovery), and builds the data foundation needed if the project eventually pursues carbon credit certification.
Taken together, these three engagements illustrate the breadth of what satellite-based analytics can deliver for blue carbon:
Assessment and risk analysis. The Senegal project shows how satellite data and dynamic modeling can answer the permanence questions that methodologies require. Building a 100-year SLR projection that integrates IPCC scenarios, elevation models, accretion, subsidence, and habitat migration goes far beyond checkbox compliance. It gives project developers and credit buyers genuine confidence in long-term viability.
Feasibility and site selection. The India project demonstrates how remote sensing transforms early-stage decision-making. Analyzing 70,000 hectares of historical mangrove area across nearly three decades of satellite data, classifying deforestation patterns, degradation trends, and land use transitions at scale, would be practically impossible through field work alone. The result is a data-driven foundation for selecting restoration sites where intervention will deliver the most impact.
Ongoing monitoring and verification. The Vietnam project highlights the operational value of satellite monitoring for conservation organizations working in challenging tropical environments. Consistent, frequent data delivery through cloud-penetrating SAR and optical imagery supports both programmatic reporting and the MRV infrastructure that carbon markets demand.
These three phases, assessment, feasibility, and monitoring, map directly to the project lifecycle that carbon standards define. And in each case, satellite analytics isn't replacing field data. It's complementing it, extending it into areas that are difficult to survey on the ground, and providing the wall-to-wall coverage that spot sampling alone cannot achieve.
The direction of travel is clear. The latest methodologies from both Verra and Gold Standard are converging on remote sensing as a core component of blue carbon MRV.
Gold Standard's Sustainable Management of Mangroves methodology, released in 2024, offers four quantification approaches: remote sensing, field measurement, models, and IPCC defaults. The methodology explicitly acknowledges that mangrove environments are difficult to access and that remote sensing provides a practical, scalable alternative for estimating biomass and tracking change.
Research supports this shift. A study on Senegal mangrove plantations found that combining Sentinel-1 and Sentinel-2 satellite data with machine learning models explained 71 to 90% of aboveground biomass variability, and that satellite model-assisted estimates dramatically reduced the number of field plots required to achieve the same statistical confidence as ground-only sampling.
At Kanop, our platform is built to deliver exactly what these methodologies require: high-resolution biomass estimates with uncertainty quantification, historical land use analysis from multi-decadal satellite archives, custom land cover classification, and ongoing change detection. All delivered through our web application and API, with the transparency and auditability that verification bodies expect.
The blue carbon market is still early. Most of the world's mangrove coastlines remain unmapped at the resolution and frequency that carbon projects require. Methodologies are evolving. New standards are emerging. And the gap between buyer demand for high-quality blue carbon credits and the supply of verified projects continues to widen.
We see this as an opportunity to do meaningful work. Every blue carbon project that gets assessed rigorously, designed with accurate data, and monitored consistently brings the market closer to the integrity it needs. Our role is to provide the satellite intelligence that makes that possible.
If you're developing, investing in, or evaluating a blue carbon project and want to understand how satellite data can support your work, reach out to us at hello@kanop.io. We'd welcome the conversation.