Nature data analytics platform

Measure the climate and biodiversity impacts of nature-based projects and land use, from your desk.
MacBook mockup
Dashboard mockup
Intelligence automation

AI agents in action

Our AI agents automate complex environmental assessments through simple chat interactions.

Upload GeoJSON, select methodology, and let our AI agents handle everything from analysis to final documentation.

Get comprehensive eligibility assessments and detailed PDF reports that support confident investment and net-zero strategy decisions - making sophisticated environmental analysis accessible to any team.
Laser precise AI models crafted with care

Built for accuracy and trust

Our deep learning models are trained on 125 million hectares of LiDAR reference data, including airborne campaigns across 10 countries and spaceborne measurements spanning 76 countries, delivering precise measurements for biomass, carbon, and biodiversity across global ecosystems.

The model's multi-encoder architecture fuses optical and SAR imagery through dedicated encoders and physics-informed prediction heads. Every estimate includes a confidence interval propagated from pixel to polygon level, capturing both aleatoric and epistemic uncertainty.

Our models are rigorously validated against independent LiDAR-derived AGB reference datasets from peer-reviewed publications, covering over 1,000,000 hectares across tropical and temperate forests.
1,250,000 km²
Training area for our models
Dashboard mockup
Dashboard mockup
Precision at any scale

Multi-layer ecosystem intelligence

Our platform seamlessly integrates multiple data sources, from 30-meter regional coverage to 10-meter detailed imagery, combined with elevation models, SAR data, and historical archives.

Access over a decade of satellite observations alongside environmental data layers, all preprocessed and aligned for immediate cross-layer analysis. A temporal stabilization pipeline ensures reliable year-over-year change detection by suppressing spectral noise in stable forests while preserving genuine disturbance signals.

Monitor lands with unmatched precision, from canopy height and biomass density to carbon stock calculations, providing the spatial intelligence needed for carbon project MRV, dynamic baselining, and supply chain monitoring under GHG Protocol LSRS.
Seamless Integration

Advanced API

Kanop's API connects your sites and projects directly to our advanced analytics platform.
Designed for flexibility and ease of use, our API ensures that your environmental monitoring and reporting needs are met with precision and efficiency.
Built with security at its core, our API ensures that your data remains safe.
Dashboard mockup
Up-to-date tools and practices

Compliant with standards and frameworks

Our products are built for the voluntary carbon market and corporate sustainability reporting. We actively support leading carbon methodologies including Verra VM0047 (ARR), VM0048/VMD0055 (REDD+), Gold Standard, Isometric Biosphere Protocols, Equitable Earth, and BioCarbon Standard. For corporate reporting, our platform enables compliance with GHG Protocol Land Sector and Removals Standard (LSRS), SBTi FLAG, and TNFD. Our methodology is transparent, publicly available, and designed to be audited.
Use Cases

Built for multiple goals

Discover how our clients are using our platform

Nature-Based Solutions

Access comprehensive data services for due diligence, design, and Monitoring, Reporting and Verification (MRV) of nature-based projects.

Supply Chains

Make nature and climate-related disclosures in accordance with the CSRD, TNFD, and other essential regulations and frameworks.
Nature-based Solutions data analytics just got modern. There are no silly questions.

Frequently asked questions

Everything you need to know about our products

How long does it take to get results from an agent? 

Most assessments are completed within minutes to hours, compared to weeks with traditional consulting approaches. Complex reports typically deliver within 3 hours.

Can agents handle multiple methodologies? 

Yes, our agents are trained on VM0047, REDD+, Gold Standard, Isometric, and other major frameworks. 

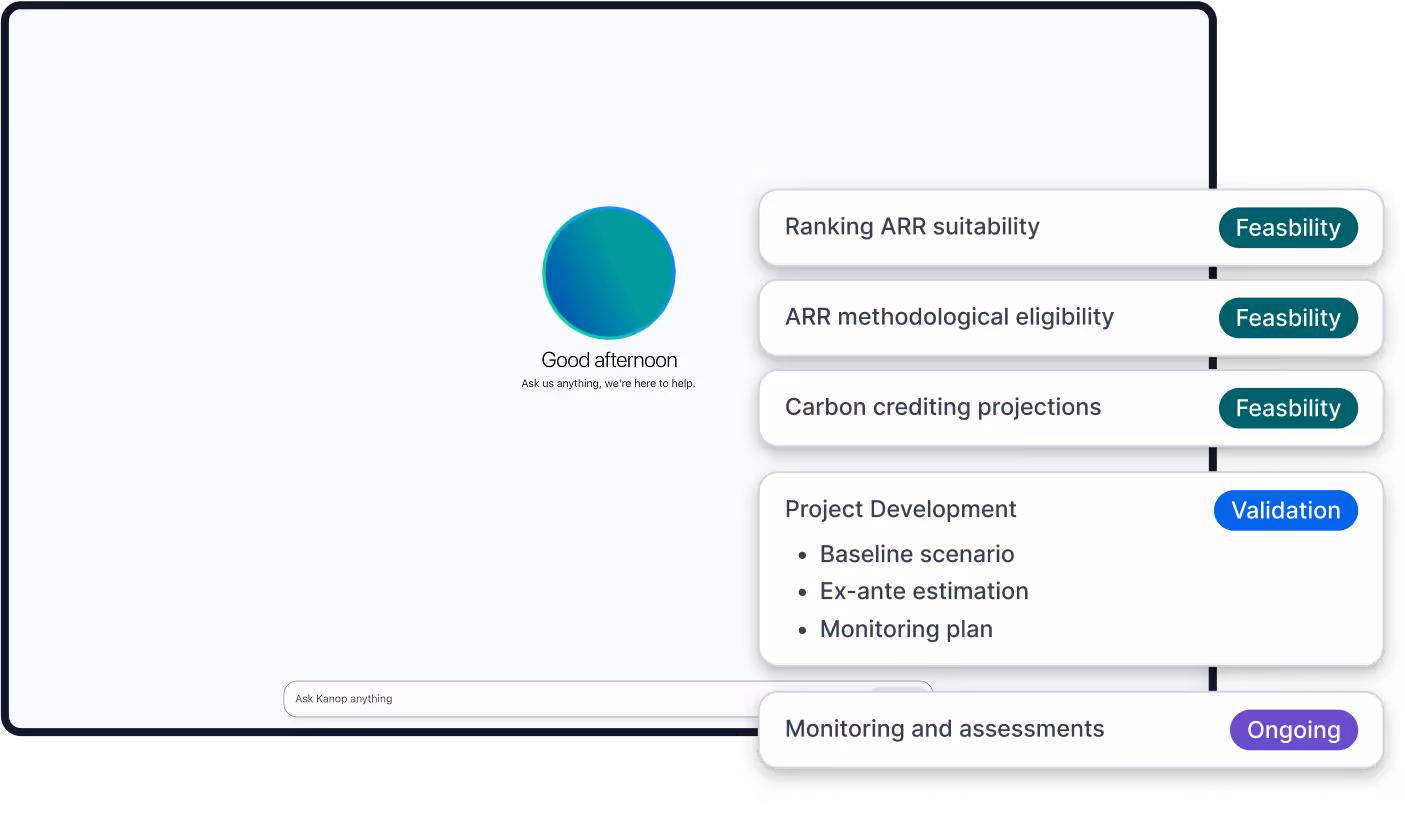
How do AI agents work with my project data? 

Our agents analyze your uploaded files (GeoJSON, shapefiles) using our proprietary AI models and guide you through methodology selection, eligibility screening, and report generation via natural conversation

What data sources do your data products use?

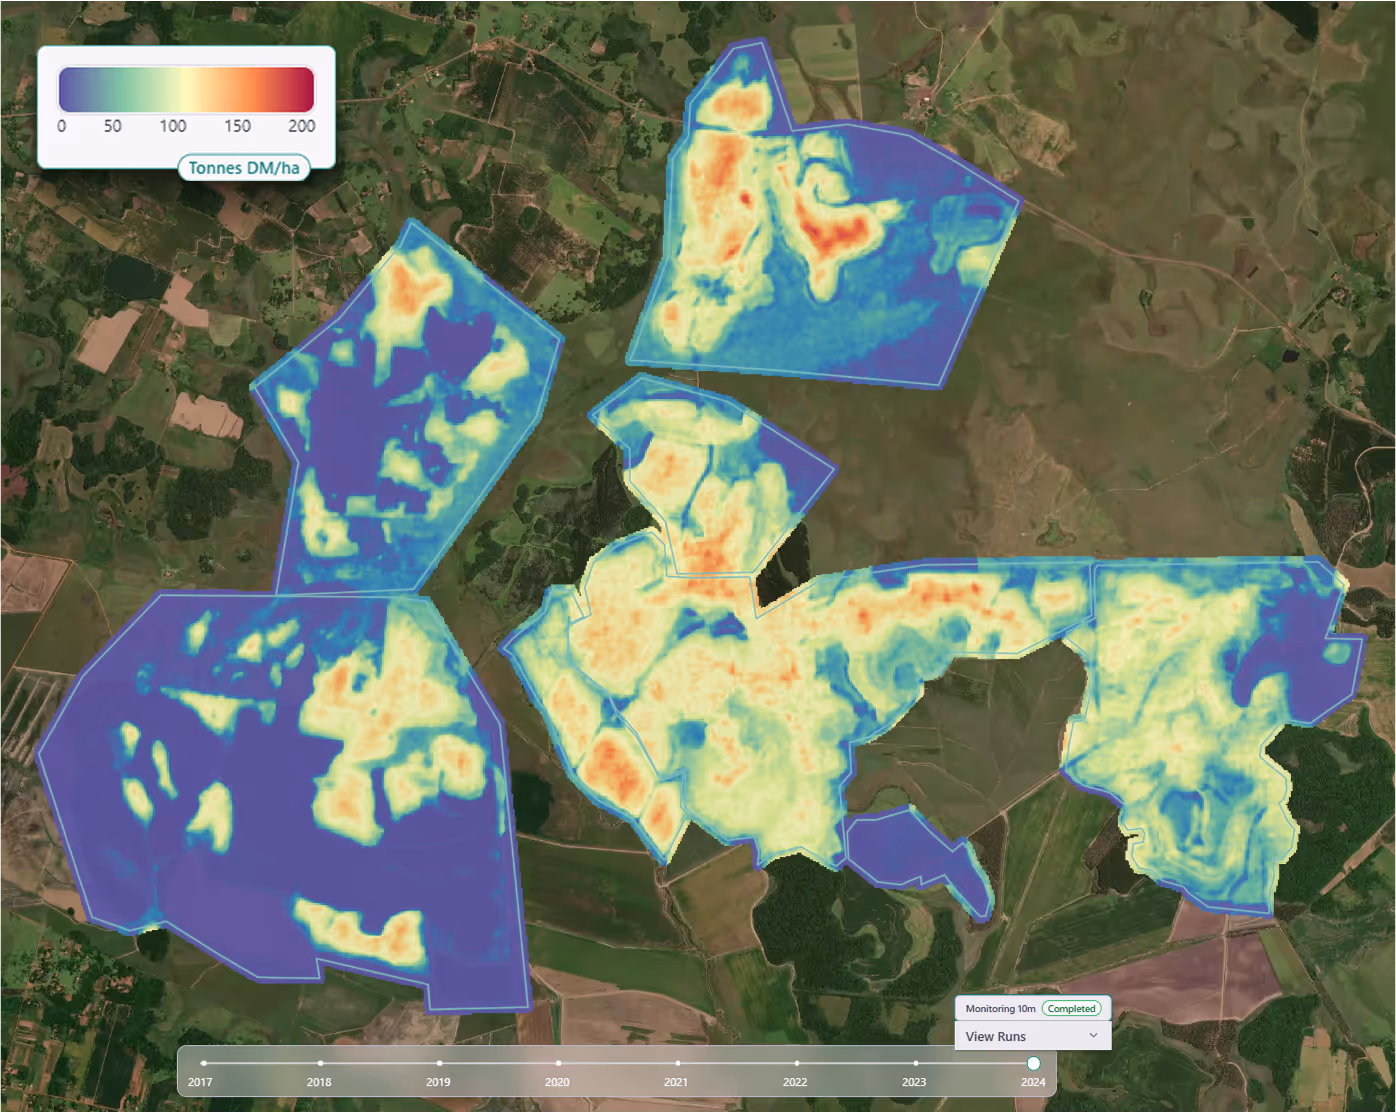
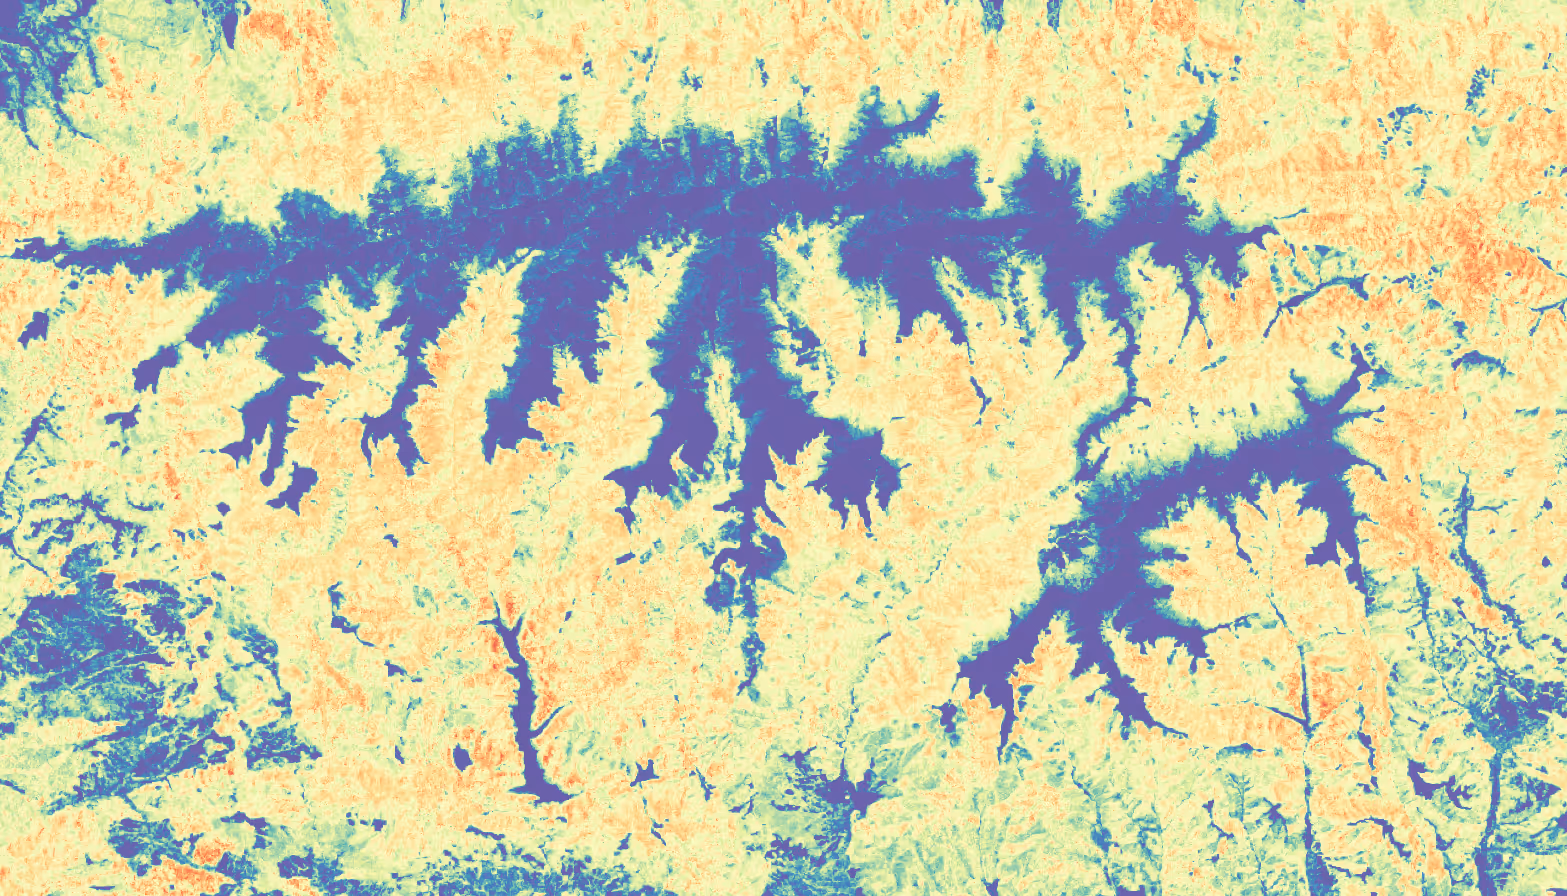
Kanop's models combine multiple satellite data sources to produce accurate biomass, canopy height, and forest cover estimates.

Optical imagery: Sentinel-2 (10-20m resolution, from 2015) and Landsat-8/9 (30m resolution, from 2013) provide spectral reflectance data linked to vegetation density and structure.

SAR (Synthetic Aperture Radar): Sentinel-1 (C-band) and PALSAR-2 (L-band) capture structural information about vegetation regardless of cloud cover or lighting conditions, making them essential for consistent monitoring in tropical regions.

Elevation data: The SRTM digital elevation model provides topographic context (slope, aspect, elevation) that informs biomass predictions.

Training data: Our deep learning models are trained on 125 million hectares of LiDAR reference data, including 42 million hectares from 754 airborne LiDAR campaigns and 83 million hectares from NASA's GEDI spaceborne LiDAR mission, spanning 76 countries.

Field measurements (optional): When available, user-provided plot-level measurements can be used to recalibrate model outputs through a Gaussian Process Regression approach, improving local accuracy.

Is there an API to access the platform?

Yes, our API connects your sites and projects directly to our advanced analytics platform. Moreover, built with security at its core, our API ensures that your data remains safe. If you're interested, let us know.

Still have questions?

As we grow our forestry projects, optimizing our measurement and on-site collection process was becoming essential in order to report to our clients. Kanop’s approach to MRV is very complimentary and easy to use.

Ecotree

Our forests under management have grown drastically as we expanded nationally and internationally. Tracking forest growth and health was becoming challenging, until we started using Kanop. Managing resources has become easy and the cost for doing so has drastically dropped.

Forestry Club de France

Overseeing the health and growth rate of all sites with over 200 million planted trees is a monumental challenge. With Kanop's provision of detailed data, we will get invaluable insight into tree health and the biodiversity of our planting sites, enabling us to pinpoint the exact areas needing additional support.

Ecosia
LogoUntitled UI logotext
Building a world where Earth's natural ecosystems are understood, protected, and integrated sustainably into tomorrow's economy and society.
Join our newsletter
Join our newsletter to stay up to date on releases.
We care about your data in our privacy policy.
Thank you! Your submission has been received!
Oops! Something went wrong while submitting the form.