Nature-based Solutions
How do you support ongoing monitoring and reporting requirements?
Once your project is validated, Kanop provides continuous monitoring services designed to keep you compliant and verification-ready throughout the crediting period.
What we measure: Our AI models deliver annual updates on key indicators at 10m or 30m resolution, including aboveground and belowground biomass, carbon stocks and CO2 equivalents, canopy cover and height, land use and land cover changes, and biodiversity metrics like Rao's Q diversity index. All outputs come with 95% confidence intervals, with optional recalibration using your field measurements.
Methodology-aligned reporting: For ARR projects under VM0047, we provide yearly stocking index monitoring for both project and control plots, performance benchmark tracking, and all supporting data files (CSV, GeoJSON, rasters) needed for VVB review. For REDD+ projects, we deliver deforestation and degradation monitoring across your project area and adjacent zones to track leakage.
Verification support: When verification events arise (at least every five years under VM0047), we review and update all control plots, prepare verification documentation, and provide direct support during the VVB process, including Q&A sessions and meetings.
Can you help with methodology selection and eligibility assessment?
Yes, this is one of the areas where Kanop adds the most value early in the project lifecycle.
Eligibility across all major standards: We run comprehensive eligibility analyses against Verra (VM0047), Gold Standard, BioCarbon Standard, Isometric, Equitable Earth, and more. Each assessment evaluates your site against methodology-specific criteria, including historical land use, forest cover over the past 10 years, soil organic carbon content, wetland presence, infrastructure, and biomass removal detection. The output is a detailed PDF report with pixel-level (25m x 25m) eligibility maps showing exactly which areas qualify, which don't, and why.
Methodology comparison: When multiple methodologies could apply, we assess your site against each one simultaneously so you can compare eligible areas and make an informed choice. This is especially useful for ARR projects where the difference in eligible hectares between standards can be significant and directly impacts your crediting potential.
Speed and cost: Our AI-powered Eligibility Assessment Agent can deliver results in days rather than the 3 to 4 weeks typically required with traditional consulting, reducing due diligence costs by up to 60%. This lets you screen more sites within the same budget and move faster on the ones that matter.
Deeply integrated with carbon standards: We work directly with standard-setting bodies including Verra, Gold Standard, Isometric, Open Forest Protocol, BioCarbon Standard, and others, contributing to methodology development and ensuring our analyses stay aligned with the latest requirements.
How can Kanop help streamline my project development process?
Kanop supports nature-based carbon projects across the entire development lifecycle, from early-stage screening to ongoing monitoring, using satellite imagery, AI, and field measurements.
Assessment: Quickly identify high-potential sites and screen project opportunities at scale. Our AI-powered Eligibility Assessment Agent evaluates sites against all major carbon standards (Verra, Gold Standard, BioCarbon, Isometric, and more) in days rather than weeks, reducing due diligence costs by up to 60% and delivering pixel-level eligibility maps to inform your project boundaries and methodology selection.
Design & Validation: Accelerate the path to certification with packaged services including dynamic baseline scenario establishment, ex-ante carbon estimations, inventory sampling strategy design, and custom support for remote sensing-compatible methodologies. These services are built to align with VVB expectations and help ensure a smooth validation process.
Monitoring & Verification: Build long-term credibility with reliable, frequent monitoring reports covering carbon stock changes, land use and land cover dynamics, and stocking index tracking for performance benchmarking.
Can you handle my entire portfolio across different geographies?
Yes. Kanop's platform is built for global coverage and portfolio-scale operations.
Our data products cover terrestrial ecosystems worldwide, including tropical rainforests, temperate forests, agroforestry systems, mangroves, wetlands, and grasslands. Whether your projects are in Latin America, Sub-Saharan Africa, Southeast Asia, Central Asia, or elsewhere, you get the same analytical framework and data quality. We provide a full historical archive going back to 2013 with annual data points, and can measure millions of hectares in a matter of days, making it practical to assess both individual sites and entire jurisdictions.
How do you assess investment risks for nature-based projects?
Kanop helps investors de-risk nature-based projects by providing scientifically validated, audit-ready data at every stage of the investment decision.
Pre-investment due diligence: Before you commit capital, we deliver rapid feasibility and eligibility assessments that verify whether a site meets the requirements of leading carbon standards. Our AI-powered Eligibility Assessment Agent can screen large, geographically dispersed project areas in days rather than weeks, reducing due diligence costs by up to 60% while surfacing risks early, such as ineligible zones, historical land use issues, or methodology constraints that could limit crediting potential.
Baseline and additionality validation: For projects already in development, we establish scientifically robust dynamic baselines that accurately quantify additionality. This is critical for avoiding over-crediting risk. For example, we've helped investors evaluate whether transitioning to newer methodologies like VM0047 would impact their credit issuance outlook, providing clear scenario comparisons to inform the decision.
Carbon crediting projections: We model expected carbon sequestration and credit issuance under different methodologies, combining growth modeling with dynamic baseline simulations. For REDD+ projects, we also quantify the impact of varying degrees of leakage on total credit issuance. These projections give you a realistic picture of expected financial returns before validation begins.
Portfolio-level consistency: Our platform applies consistent methodologies across diverse ecosystems and geographies, from tropical rainforests to agroforestry systems and mangroves. Whether you're screening a single site or evaluating a pipeline of opportunities, every assessment follows the same rigorous analytical framework, making it easier to compare projects and allocate capital.
Ongoing performance tracking: After investment, our monitoring services provide continuous, independent measurement of carbon stocks, land use changes, and project performance benchmarks, so you can verify that projects are delivering on their commitments and flag underperformance early.
All outputs are transparent, shareable, and designed to be audit-ready for verification bodies, co-investors, and other stakeholders.
Is Kanop compatible with Verra, Gold Standard and other VCM standards?
Yes. Kanop's platform supports all major carbon standards including Verra, Gold Standard, Isometric, Equitable Earth, BioCarbon Standard, Cercarbono and others.
We have been selected by Isometric as a nature-based service partner across both feasibility assessment and earth-observation data. Projects certifying under Isometric's Biosphere Protocols for reforestation, improved forest management, mangrove restoration, and agroforestry can integrate Kanop's monitoring directly within Isometric's certification workflow.
We are also an approved data provider for Equitable Earth, supplying satellite-derived earth-observation data directly into their certification pipeline. We support their M001 methodology for terrestrial forest restoration with automated eligibility assessments and dynamic baseline simulations.
Our satellite-based MRV technology aligns with methodological requirements throughout the entire project lifecycle, from eligibility assessment through baseline establishment to ongoing monitoring and verification. All measurements are scientifically validated and fully auditable, delivering the transparency and accuracy essential for successful project certification and investor confidence.
How do you support Afforestation, Reforestation, and Revegetation (ARR) project development?
ARR is one of Kanop's deepest areas of expertise. We offer a dedicated ARR Project Toolbox that covers every stage, from site identification to ongoing verification support.
Site selection and suitability ranking: We assess and rate your area of interest for ARR potential by combining biomass data, canopy metrics, elevation, slope, NDVI, and other environmental parameters. The result is a ranked map showing which zones are most promising for planting, so you can focus resources where they'll have the greatest impact.
Eligibility analysis: We evaluate your project area against all leading ARR methodologies, including Verra VM0047, Gold Standard ARR, BioCarbon Standard, Isometric Reforestation Protocol, and Equitable Earth, among others. You receive pixel-level eligibility maps and a detailed report showing which areas qualify under each methodology and where constraints exist. This lets you choose the standard that maximizes your eligible project area and crediting potential.
Carbon crediting projections: Before committing to a methodology, we model expected carbon sequestration and credit issuance under different standards so you can compare outcomes and make data-driven decisions about your project design.
PDD support (VM0047): We produce PDD-ready documentation for Sections 8 and 9, covering dynamic baseline construction, performance benchmark derivation, project and leakage emissions quantification, ex-ante estimation for the full crediting period, and a comprehensive monitoring plan with field sampling protocols and QA/QC procedures. Typical delivery is 6 to 8 weeks, and we provide direct VVB support during validation.
Ongoing monitoring: After validation, we deliver annual stocking index updates for both project and control plots, land use change detection, and carbon stock tracking. All data is accessible via the Kanop web app and API, keeping you verification-ready at all times.
We work directly with Verra, Gold Standard, Isometric, and other standard-setting bodies on methodology development, so our tools stay aligned with the latest requirements. You can explore our full ARR offering in detail through our ARR Project Toolbox.
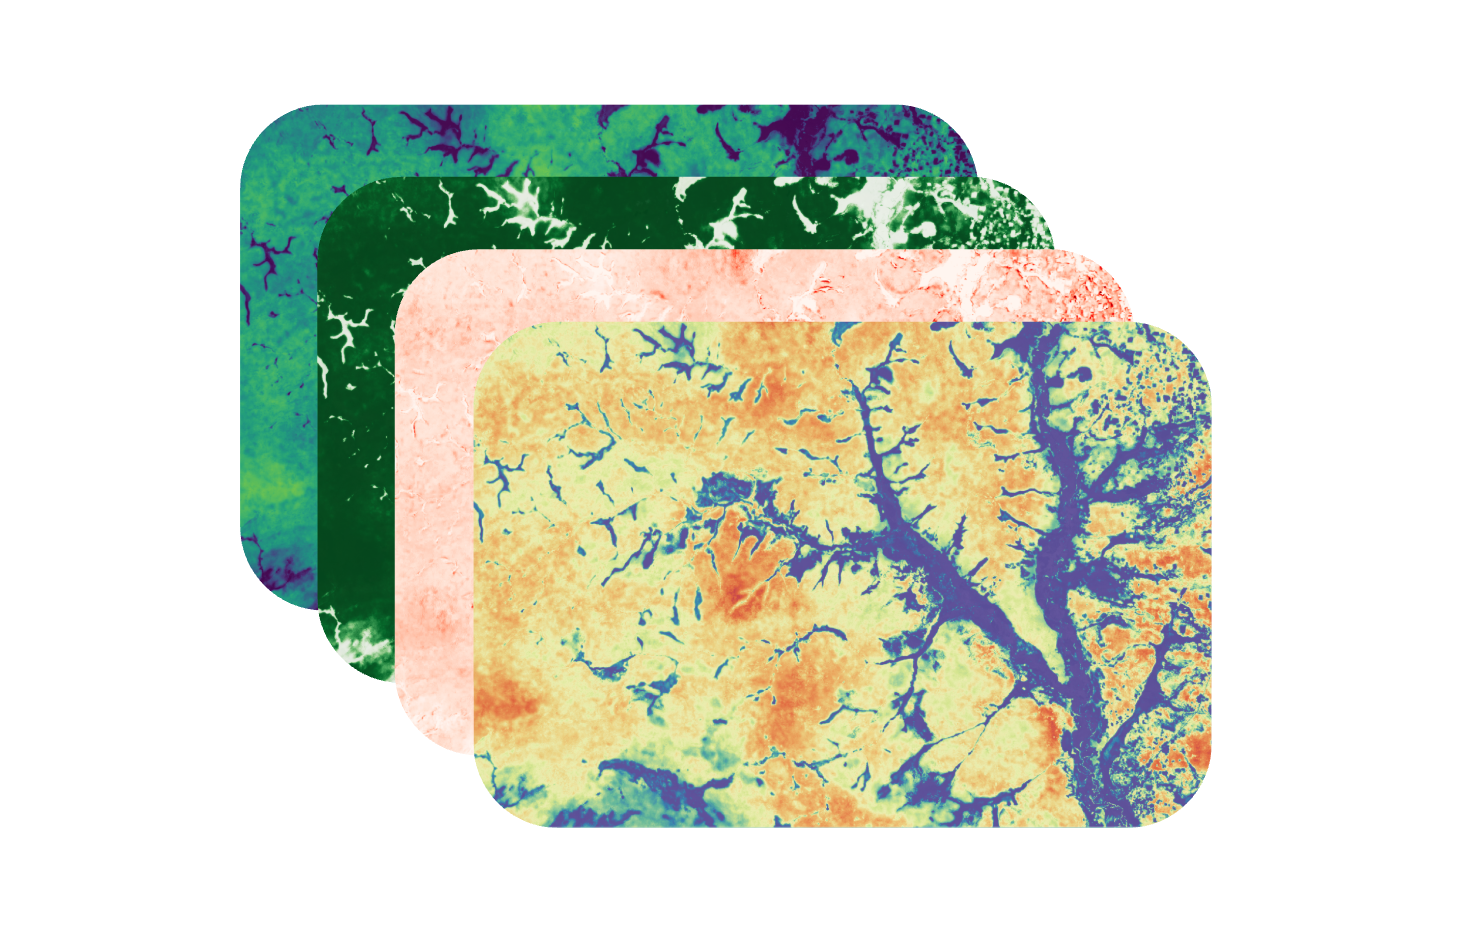
What are the different data products available?
Kanop delivers site-level nature intelligence across three core data layers:
Land Use & Land Use Change to map and monitor deforestation, forest degradation, and land conversion across your sourcing regions, with historical baselines going back over a decade.
Carbon Stocks & Removals to quantify above and belowground biomass, carbon stock changes, and removal rates at the plot level, with field-calibrated models and uncertainty quantification at 95% confidence intervals.
Canopy & Vegetation Metrics including canopy cover, canopy height, and forest cover at 10 to 30-meter resolution, enabling precise tracking of agroforestry systems, restoration progress, and supply chain environmental performance.
All data products are delivered with audit-ready documentation and are designed to feed directly into EUDR due diligence statements, GHG Protocol LSRS inventories, SBTi FLAG target tracking, and TNFD/CSRD disclosures. Whether you are monitoring cocoa farms in West Africa or soy sourcing in South America, you get the granular, verifiable evidence your compliance, sustainability, and procurement teams need.
Is ground data necessary?
While our AI models deliver accurate results without ground data, incorporating your field measurements can significantly enhance precision and reduce uncertainty. This recalibration process is especially valuable for meeting specific certification requirements such as those in Verra's VM0047 methodology. Our platform makes integrating field data straightforward, allowing you to maximize both accuracy and cost-efficiency based on your project's specific needs.
Is Kanop capable of generating baseline data for both static and dynamic baseline approaches?
Yes, we effectively establish both static and dynamic baselines for carbon projects. For static baselines, our platform provides historical data back to 2000, creating fixed reference points for measuring project performance.
For dynamic baselines (like VM0047), we support the entire process - from selecting representative project plots and matching control plots using k-nearest optimal matching, to monitoring stocking index over time and deriving performance benchmarks.
Which allometric relations are used?
At every stage of calculation, we employ a range of specific allometric relations tailored to the biome under consideration. These relations play a crucial role in determining important metrics such as aboveground biomass, belowground biomass, and carbon stock. Users can configure their own allometric relationships directly on the platform to customize calculations for their specific project needs.
How accurate is the estimation of the aboveground biomass?
Accuracy depends on the scale of analysis. In carbon accounting and MRV, the relevant metric is typically the average biomass over a project area or polygon, not individual pixel values.
At the site level (the scale most relevant to carbon accounting), our model achieves an RMSE of 41.7 t DM/ha (relative RMSE = 27%) and an R² of 0.73, validated across 110 independent sites covering over 1,000,000 hectares of LiDAR-derived reference data from peer-reviewed publications. This means the model reliably estimates the average carbon stock of a project area.
At the pixel level (30m resolution), the global weighted RMSE is 94.9 t DM/ha. This is roughly double the site-level figure, which is expected: fine-scale errors from canopy gaps, mixed pixels, and terrain effects partially cancel out when averaged over larger areas.
Every estimate includes a confidence interval (95% by default), propagated from pixel to polygon level and accounting for spatial correlation between pixels. When field measurements are available, an optional post-calibration step using Gaussian Process Regression can further reduce uncertainty at the local level.